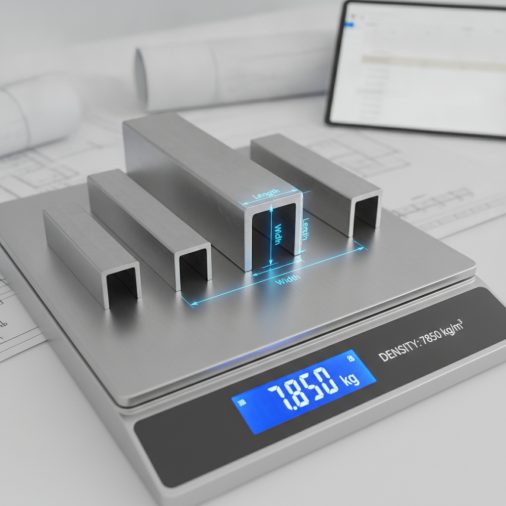
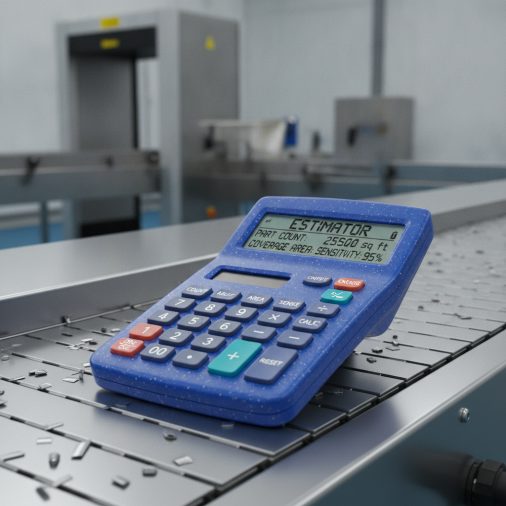
Metal detectable plastics and components are engineered to trigger metal detection equipment if a fragment breaks off and enters a product stream, making them a critical layer of contamination control in food processing, pharmaceutical manufacturing, and precision fabrication environments. This metal detectable calculator helps quality managers, production engineers, and safety planners estimate how many detectable parts are required for a given line, calculate the minimum detectable fragment size relative to detector aperture, and cross-check whether a chosen component density meets standard coverage guidelines — all before committing to a purchase order or a HACCP audit.
Metal Detectable Calculator: Part Count, Coverage Area & Detection Sensitivity Estimator
Calculate the number of metal detectable components needed, estimate coverage area, and evaluate detection sensitivity thresholds for food-safe and industrial contamination-control planning.
How to Use This Calculator
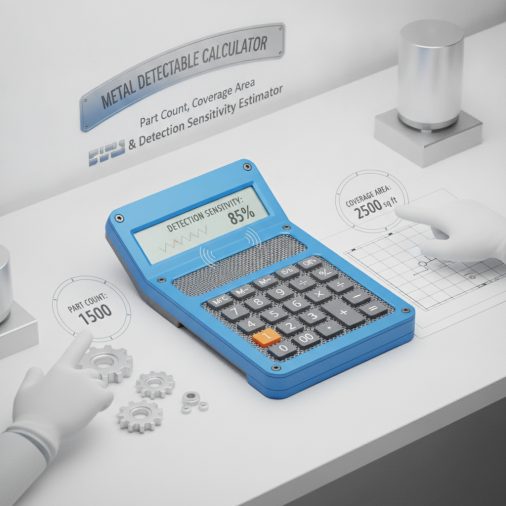
Follow these steps to get accurate planning estimates from the calculator:
- Enter your production line length and select the unit (metres or feet). This represents the total conveyor or processing run where detectable components will be deployed.
- Enter the detector aperture height — the vertical opening of your metal detection tunnel. This is used to estimate the minimum detectable sphere diameter.
- Input the number of detectable components currently planned or installed on the line.
- Enter the average component mass in grams. This helps estimate total detectable mass deployed.
- Select your product type to apply the appropriate wet/dry product effect factor, which influences effective detection sensitivity.
- Review all four result cards: component spacing, minimum detectable fragment size, total detectable mass, and a sensitivity index score.
Understanding the Calculator Inputs
Production Line Length: Enter the total length of the conveyor belt, processing line, or work zone where metal detectable components will be placed. Use the unit selector to switch between metres and feet — the calculator converts feet to metres internally so all results are consistent. For multi-stage lines, enter the combined length of all segments that share a single detector.
Detector Aperture Height (mm): This is the vertical internal dimension of your metal detection tunnel opening, measured in millimetres. It is the single most important factor in determining what fragment size can be reliably detected. Aperture values typically range from 60 mm for small-product tunnels to 500 mm or more for bulk conveyors. Check your detector’s specification sheet for the exact figure.
Number of Detectable Components: Enter the total count of metal detectable parts — scrapers, gaskets, O-rings, clips, brushes, or other items — that will be present on the line at any one time. This drives the spacing and coverage density calculations.
Average Component Mass (g): Enter the mean mass of a single detectable component in grams. If components vary widely in size, use a weighted average. This value is used to calculate total detectable mass deployed, which is useful for procurement and inventory planning.
Product Type / Effect Factor: Metal detectors are affected by the electrical conductivity and moisture content of the product being inspected. Dry, non-conductive products (grains, powders, dry snacks) allow the highest sensitivity, so the effect factor is 1.0. Moist products (fresh meat, cheese, bakery) reduce effective sensitivity and carry a factor of 1.2. Wet, high-conductivity products (brines, marinades, fresh fish) have the greatest masking effect and use a factor of 1.5. Selecting the correct category ensures the minimum detectable fragment estimate reflects real-world conditions rather than ideal laboratory performance.
Understanding Your Results
Component Spacing Along Line: This result shows the average distance in metres between consecutive detectable components. A smaller spacing means denser coverage and a lower risk that a broken fragment travels far before being detected or recovered. Most food-safety guidelines recommend spacing no greater than 1–2 metres in high-risk zones.
Minimum Detectable Fragment Diameter: This is the estimated smallest spherical fragment diameter (in mm) that your detector configuration can reliably identify under the selected product conditions. It is derived from the aperture height and the product effect factor. Use this figure to verify that your chosen detectable components will produce fragments large enough to trigger the detector if they break.
Total Detectable Mass Deployed: The combined mass of all detectable components on the line in grams. This figure is useful for procurement, stock rotation planning, and for documenting the total quantity of foreign-body-risk material introduced into the production environment — a requirement in many HACCP and BRC audit frameworks.
Coverage Density (components per 10 m): Normalises the component count to a standard 10-metre segment, making it easy to compare different line configurations or benchmark against internal standards. A density below 2 per 10 m may indicate under-coverage in high-risk applications.
Sensitivity Index: A dimensionless planning score that combines aperture height and product effect factor into a single number. Higher scores indicate a more sensitive detection environment. Use it as a quick comparison tool when evaluating different detector models or line configurations — not as a substitute for validated detector performance data.
Estimated Fragment Detection Threshold (ferrous): A secondary estimate specifically for ferrous (iron/steel) fragments, which are the easiest metal type for most detectors to find. This threshold is typically lower than the general minimum detectable diameter, reflecting the stronger magnetic signal ferrous metals produce. It provides a best-case lower bound for your detection capability.
Calculation Formulas Explained
Component Spacing = (Line Length × Unit Factor) ÷ Number of Components. The line length is first converted to metres by multiplying by the unit factor (1 for metres, 0.3048 for feet). Dividing by the component count gives the average gap between parts in metres.
Minimum Detectable Fragment Diameter = Aperture Height (mm) × 0.003 × Product Effect Factor. The constant 0.003 is a conservative planning approximation derived from published metal detector performance data, which consistently shows that the minimum detectable sphere diameter for a balanced-coil detector is approximately 0.3% of the aperture height under ideal dry-product conditions. The product effect factor (1.0, 1.2, or 1.5) scales this upward to reflect real-world sensitivity reduction caused by product conductivity. This is a planning estimate only — actual performance must be validated on your specific equipment.
Total Detectable Mass = Number of Components × Average Component Mass (g). Simple multiplication giving the aggregate mass of all detectable material on the line.
Coverage Density = (Number of Components ÷ Line Length in metres) × 10. Normalises component count to a 10-metre baseline for easy benchmarking.
Sensitivity Index = round((1 ÷ Minimum Detectable Fragment Diameter) × 10). The reciprocal of the fragment diameter is scaled by 10 and rounded to an integer. Because a smaller detectable fragment means higher sensitivity, the reciprocal relationship correctly produces a higher score for more sensitive configurations.
Ferrous Detection Threshold = Aperture Height × 0.0025. Ferrous metals produce a stronger inductive signal than non-ferrous or stainless steel. The constant 0.0025 (0.25% of aperture) reflects the typical improvement in ferrous sensitivity relative to the general 0.3% figure, based on published detector manufacturer guidance.
Worked Example
Suppose a food manufacturer is setting up a fresh-meat processing line that is 40 metres long. The metal detection tunnel has an aperture height of 200 mm. The quality team plans to deploy 15 detectable components (scrapers, gaskets, and guide rails), each with an average mass of 30 g. The product is fresh meat, so the moist/low-conductivity factor of 1.2 applies.
Step 1 — Component Spacing: (40 × 1) ÷ 15 = 2.67 m between components on average. The quality manager notes this slightly exceeds the 2 m guideline for high-risk zones and considers adding two more components.
Step 2 — Minimum Detectable Fragment Diameter: 200 × 0.003 × 1.2 = 0.72 mm. Any fragment smaller than 0.72 mm may not reliably trigger the detector under these conditions. The team checks that their chosen detectable plastic components are certified to produce fragments no smaller than 1.0 mm when fractured.
Step 3 — Total Detectable Mass: 15 × 30 = 450 g of detectable material on the line. This is logged in the HACCP foreign-body register.
Step 4 — Coverage Density: (15 ÷ 40) × 10 = 3.75 components per 10 m. This exceeds the minimum benchmark of 2 per 10 m, indicating adequate coverage density.
Step 5 — Sensitivity Index: round((1 ÷ 0.72) × 10) = round(13.89) = 14 pts. Compared to a dry-product line with the same aperture (index ≈ 17 pts), the fresh-meat environment reduces sensitivity by about 18%, which aligns with industry expectations.
Step 6 — Ferrous Threshold: 200 × 0.0025 = 0.50 mm. Ferrous fragments as small as 0.5 mm should be detectable, providing a useful lower bound for stainless-steel component selection decisions.
How to Interpret the Results
Use the Component Spacing result as your primary coverage check. For high-risk food contact zones, aim for spacing below 1.5 m; for lower-risk packaging or dry-goods areas, up to 3 m may be acceptable depending on your HACCP risk assessment. If spacing exceeds your internal threshold, increase the component count until the target is met.
The Minimum Detectable Fragment Diameter should always be smaller than the smallest fragment your detectable components can produce when broken. If the calculated threshold is larger than the component’s certified fragment size, your detector may not catch every breakage event — consider a detector with a smaller aperture or a higher-sensitivity model.
The Sensitivity Index is most useful as a relative comparison tool. Run the calculator for two different detector aperture sizes or product types and compare the index scores to quantify the sensitivity trade-off. A drop of more than 20% in the index when switching product types is a signal to review your detection validation protocol.
The Ferrous Threshold provides a best-case scenario. If your components contain stainless steel or non-ferrous elements, the actual detection threshold will be higher (less sensitive) than this figure. Always validate with test pieces on your specific detector.
Common Mistakes to Avoid
- Using aperture width instead of height: Metal detector sensitivity is governed by the smaller of the two aperture dimensions. Always enter the height (vertical dimension) of the tunnel opening, not the width. Using the larger dimension will underestimate the minimum detectable fragment size and give a falsely optimistic result.
- Ignoring the product effect factor: Many planners default to the dry-product setting even for moist or wet applications. This can underestimate the minimum detectable fragment diameter by 20–50%, leading to a false sense of security. Always select the factor that matches your worst-case product condition.
- Counting components across multiple lines as one: If your facility has three parallel processing lines each with its own detector, calculate each line separately. Pooling components across lines inflates the coverage density figure and masks under-coverage on individual runs.
- Confusing line length with detector belt length: The line length input should represent the full zone where detectable components are deployed, not just the length of the detector belt itself. Include upstream preparation areas and downstream packaging zones if components are present there.
- Treating the Sensitivity Index as a pass/fail score: The index is a relative planning tool, not a compliance metric. A score of 14 does not mean the line passes or fails any regulatory standard. Compliance requires validated testing with certified test pieces on your actual equipment.
- Neglecting component mass variation: If your line uses a mix of very large and very small detectable parts, the average mass figure can be misleading. Consider running separate calculations for each component category to get accurate total mass figures for your HACCP register.
Limitations and Important Notes
This calculator provides planning-level estimates only and is not a substitute for validated metal detector performance testing, professional HACCP analysis, or compliance certification. The 0.003 and 0.0025 aperture-to-fragment-size constants are conservative approximations based on publicly available metal detector performance guidance; actual sensitivity depends on detector technology (balanced coil, ferrous-in-foil, multi-frequency), conveyor speed, product orientation, signal phase settings, and environmental electromagnetic interference.
The product effect factors (1.0, 1.2, 1.5) are generalised categories. Real products vary continuously in conductivity and moisture content, and some products (e.g., high-salt cheeses, aluminium-foil-wrapped items) may require specialised detector configurations that fall outside the scope of this tool.
Fragment shape matters: the calculator assumes spherical fragments, which represent the worst case for detection (minimum surface area). Elongated or flat fragments of the same nominal diameter may be easier or harder to detect depending on their orientation as they pass through the aperture.
This tool does not account for conveyor speed, product height within the aperture, or the position of a fragment within the product mass — all of which affect real-world detection probability. Always conduct challenge testing with certified test pieces at your actual line speed before relying on any detection system for food safety or quality assurance purposes.
Frequently Asked Questions
What is a metal detectable component and why is it used?
A metal detectable component is a part — such as a scraper blade, O-ring, gasket, brush, or clip — manufactured from a plastic or elastomer compound that contains a detectable additive, typically iron oxide or a similar ferromagnetic filler. If the component breaks during production and a fragment enters the product stream, the fragment will trigger a standard metal detection system and cause the affected product to be rejected. They are used in food processing, pharmaceutical manufacturing, and other industries where physical contamination control is a regulatory or customer requirement. Unlike standard blue-coloured food-safe plastics (which rely on visual inspection), metal detectable parts provide an automated, instrument-based safety net.
How does aperture height affect detection sensitivity?
The aperture height of a metal detection tunnel is the vertical internal dimension of the opening through which product passes. Sensitivity decreases as aperture size increases because the detector coils must generate a field across a larger volume, reducing the signal-to-noise ratio for small fragments. As a general planning rule, the minimum detectable sphere diameter is roughly proportional to the aperture height — a 300 mm aperture will typically detect fragments about twice as large as a 150 mm aperture under the same product conditions. This is why high-risk applications often use the smallest practical aperture for the product being inspected.
What is the product effect factor and how do I choose the right one?
The product effect factor accounts for the fact that electrically conductive or moist products generate their own signal as they pass through the detector coils, partially masking the signal from metal fragments. Dry, non-conductive products like flour, sugar, or dry biscuits have minimal masking effect (factor 1.0). Fresh meat, cheese, and bakery products with moderate moisture content use a factor of 1.2. Wet, high-conductivity products such as brined fish, fresh poultry in liquid, or products in conductive packaging use a factor of 1.5. When in doubt, choose the higher factor to ensure your planning estimates are conservative rather than optimistic.
Can this calculator be used for pharmaceutical or non-food applications?
Yes, the underlying geometry and sensitivity relationships apply to any balanced-coil metal detection system regardless of industry. However, pharmaceutical applications often use more stringent detection thresholds and may require validation under GMP (Good Manufacturing Practice) frameworks such as EU Annex 11 or FDA 21 CFR Part 11. The product effect factor for pharmaceutical powders and tablets is typically close to 1.0 (dry, non-conductive), so selecting the dry-product option is usually appropriate. Always validate results against your specific regulatory requirements and equipment qualification documentation.
How many detectable components per metre is considered adequate coverage?
There is no single universal standard, as requirements vary by industry, product risk category, and customer specification. As a general planning benchmark, many food-safety frameworks and retailer codes of practice suggest at least one detectable component per 1–2 metres in direct food-contact zones, and one per 2–3 metres in indirect or low-risk areas. The coverage density result in this calculator (expressed as components per 10 m) lets you compare your configuration against these benchmarks. A density below 2 per 10 m (one component every 5 m) is often considered insufficient for high-risk food contact applications and should trigger a review of component placement.
Does the colour of a metal detectable component affect its detectability?
No — the detectability of a metal detectable component is determined entirely by the ferromagnetic or conductive additive in the material compound, not by its colour. The traditional blue colour used for many food-safe detectable plastics is a visual identification aid to help operators spot fragments during manual inspection, but it has no effect on how the metal detector responds to the material. Some manufacturers now offer detectable components in other colours (red, green, yellow) to match colour-coded hygiene zoning systems without compromising detection performance.
What is the difference between the minimum detectable fragment diameter and the ferrous detection threshold?
The minimum detectable fragment diameter in this calculator represents a general estimate applicable to mixed or unknown metal types — it uses a conservative constant of 0.3% of aperture height. The ferrous detection threshold uses a slightly lower constant (0.25% of aperture height) because ferrous metals (iron and carbon steel) produce a stronger inductive signal in a balanced-coil detector than non-ferrous metals like aluminium or stainless steel. In practice, stainless steel — the most common metal in food processing equipment — is the hardest to detect and may require a threshold 1.5 to 3 times higher than the ferrous figure. Always request stainless-steel test-piece performance data from your detector supplier when specifying a system for food-contact applications.
How do I validate the results from this calculator against my actual detector?
Validation requires physical challenge testing using certified test pieces — small spheres of ferrous, non-ferrous, and stainless-steel metal of known diameter — passed through the detector at your actual line speed, product height, and phase settings. Run at least three passes of each test piece at the beginning, middle, and end of each production shift, and record all results. If your detector consistently rejects test pieces at or below the minimum detectable fragment diameter estimated by this calculator, your configuration is performing as planned. If it misses test pieces larger than the estimated threshold, review your aperture setting, conveyor speed, and phase angle, or consult your detector manufacturer. This calculator is a pre-validation planning tool, not a replacement for documented challenge testing.